Which states have been the fastest to adopt AI in the workplace?
 | March 11, 2026 | 0 min read |
AI implementation in the workplace has grown rapidly since the AI boom began in the 2020s. According to a Gallup survey, about 46 percent of U.S. workers have used AI at least a few times a year, nearly double the 2023 percentage (21 percent). Around 12 percent of workers use it daily (triple 2023’s rate), and 26 percent use it at least a few times a week. For many employees in knowledge-based industries like tech or finance, AI can be a useful tool for managing complex information, streamlining repetitive tasks and freeing up time for more important responsibilities.
While many places are seeing widespread adoption of AI in the workplace, factors like local industries, workforce makeup and access to technology mean this progress differs from one region to the next.
To learn more about the future of AI in business, the team at Ooma has analyzed data state by state to identify which areas across the U.S. have been the fastest to adopt AI in the workplace.
How we measured AI adoption by state
To decipher which states are adopting AI fastest, we looked at data from the U.S. Census Bureau’s Business Trends and Outlook Survey (BTOS). This survey measures data biweekly and gathers responses from businesses across industries and states, offering a real-time view of how companies are operating and what they’re planning.
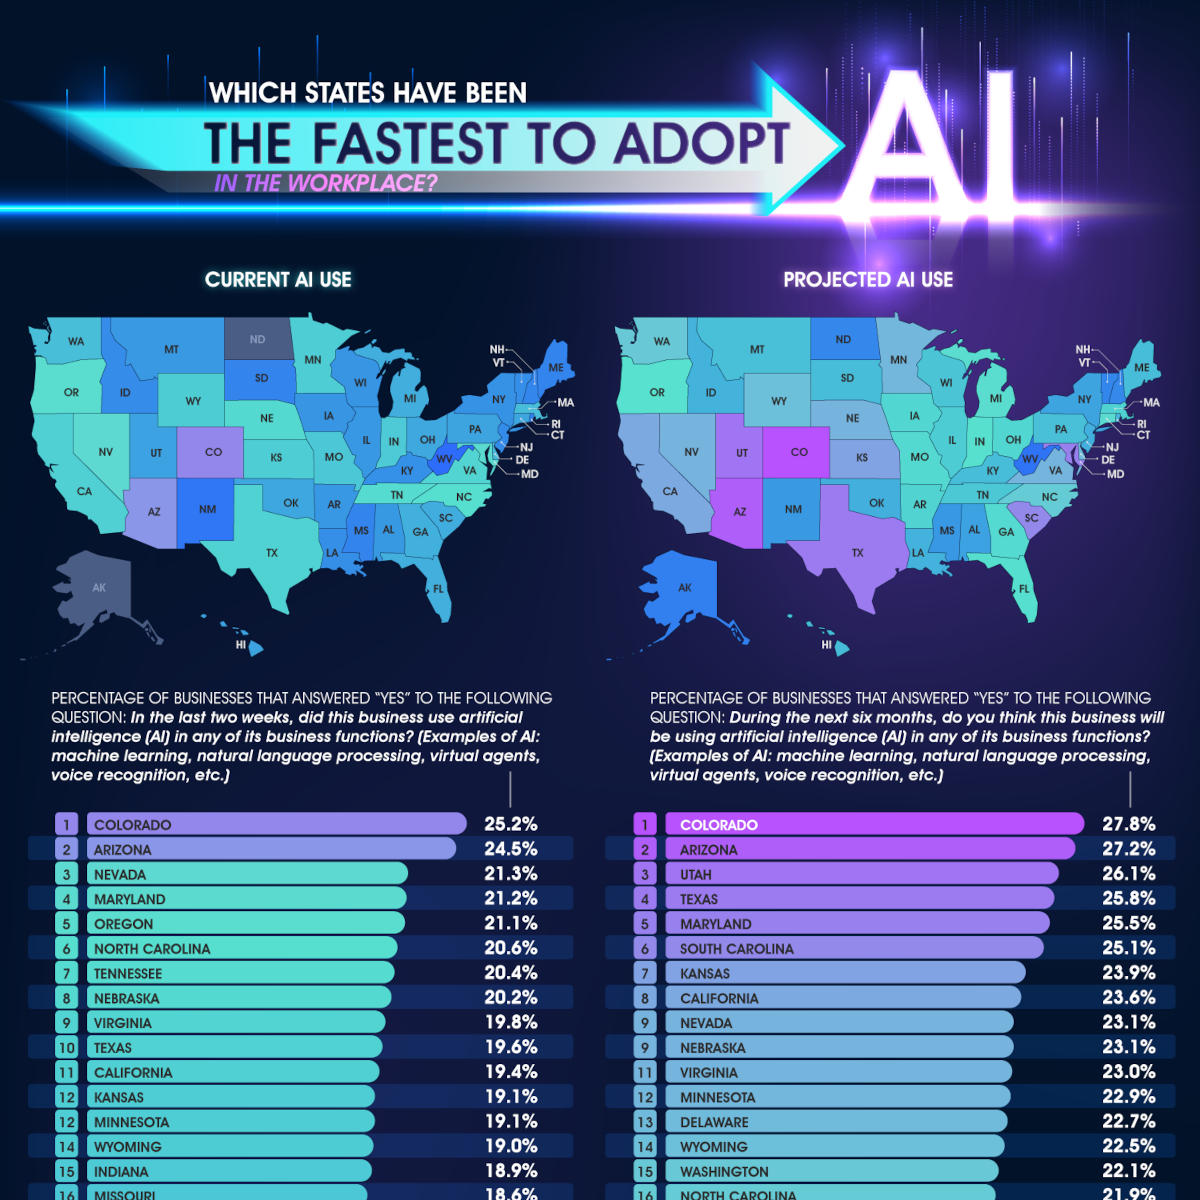
For our purposes, we focused on two specific metrics in the report. First, we looked at “Current AI Use,” which tracks the percentage of businesses that reported using artificial intelligence in the previous two weeks, including machine learning, natural language processing, virtual agents or voice recognition. Second, we examined “Future AI Use,” which identifies the percentage of businesses planning to use these tools in the next six months. Together, this data allows us to compare how quickly businesses across different regions plan to adopt AI.
AI use by state
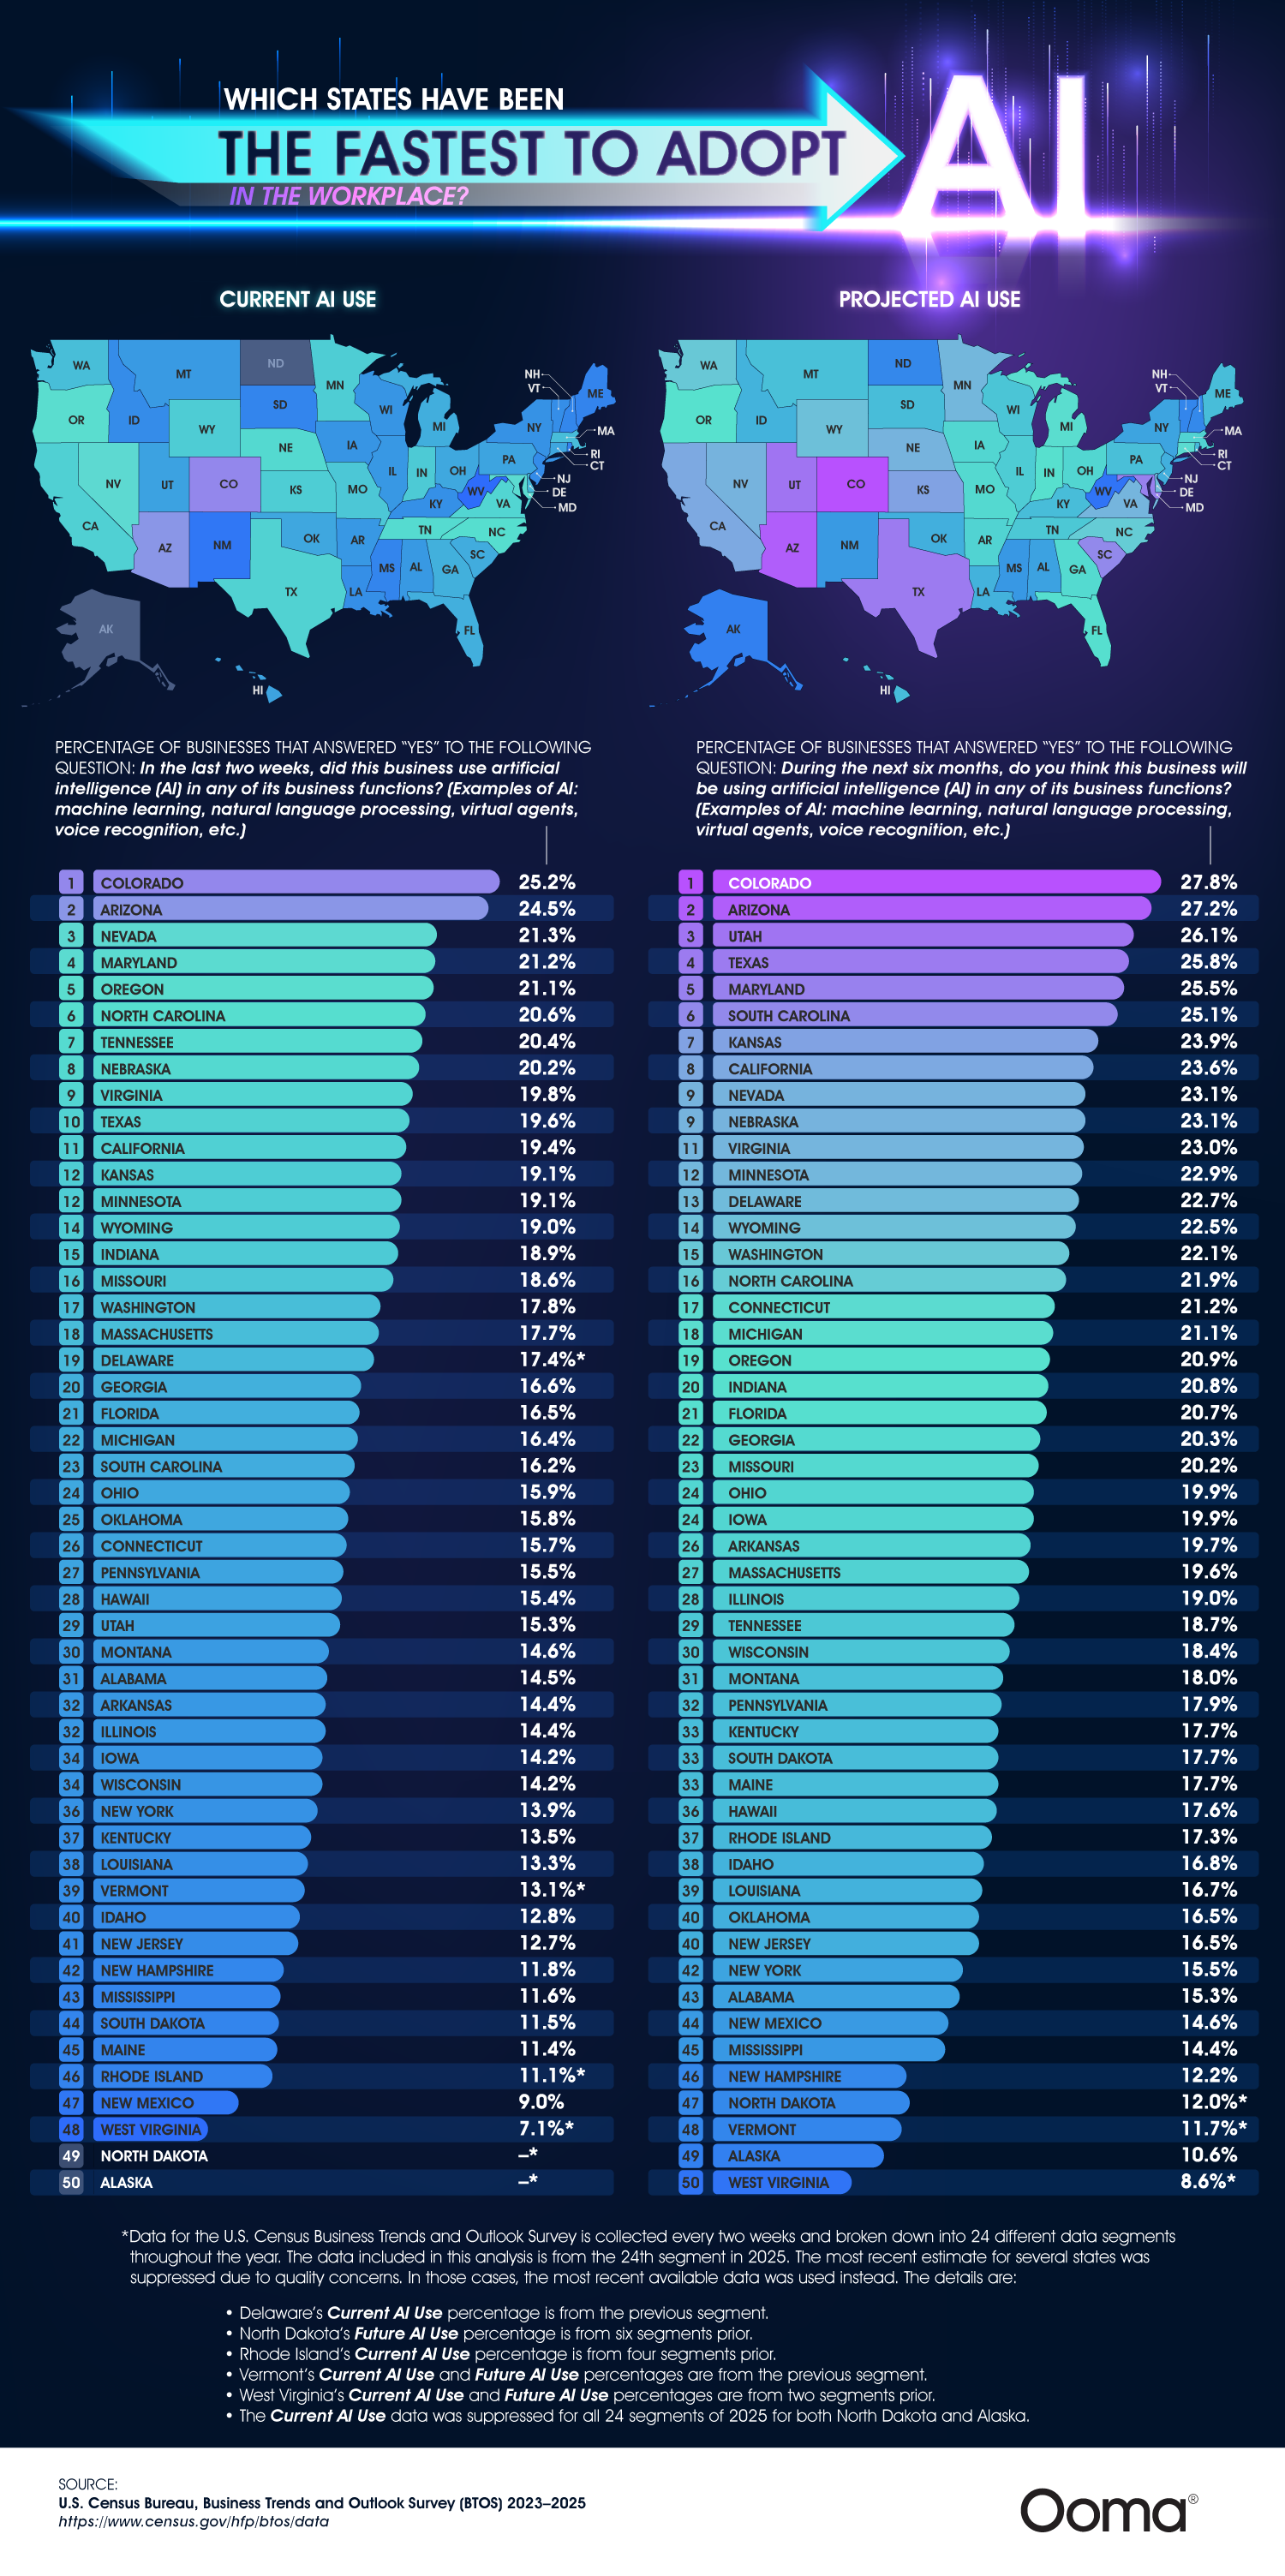
Perhaps unsurprisingly, the Western U.S. make up the majority of the frontrunners. Colorado ranks first overall in current AI adoption; the analysis found that 25.2 percent of businesses in the state reported using AI in their operations. Recently, Colorado has acquired a reputation as an emerging leader in tech. Because of this, they’ve been attracting startups and remote tech workers, two groups that may be more inclined to use digital tools and automation, which partially explains why they came out on top.
Arizona follows closely in second place, with 24.5 percent of businesses actively using AI. The state has become a major hub for semiconductor manufacturing and advanced industrial development, driven by large-scale investments in chip production and related supply chains. These industries are among the earliest adopters of AI because they rely heavily on automation, predictive maintenance, quality control, and high-volume data analysis. With Arizona’s economy increasingly shaped by high-tech manufacturing and engineering-intensive operations, businesses in the state are structurally more likely to integrate AI into day-to-day workflows.
Nevada ranks third, with 21.3 percent of businesses reporting AI use. While the state is often associated with tourism, its dominant hospitality sector—particularly in Las Vegas—is also one of the most data-intensive service industries in the country. Casinos, resorts and entertainment companies manage enormous volumes of customer transactions, loyalty data, pricing decisions and security operations. AI tools are increasingly used in these environments for demand forecasting, personalized marketing, fraud detection and operational efficiency. Nevada’s concentration of large-scale hospitality businesses helps explain why AI adoption is comparatively high. AI not only enhances the guest experience but also streamlines processes.
Maryland is the only Eastern state in the top five, with a reported use of just more than 21 percent. Thanks to its proximity to Washington, D.C., the state is home to many federal contractors, cybersecurity firms and defense agencies that handle data security and complex logistics. As in tech and hospitality, AI can be an asset for handling large, dense datasets, making this work more efficient and accurate.
Oregon sits in fifth place with 21.1 percent of businesses currently using AI. However, unlike other top-ranking states, it drops noticeably in projections for future adoption. This divergence suggests Oregon may be approaching an early AI saturation point, where many of the businesses most ready to adopt—particularly in tech and advanced services—have already done so. The slower projected growth may indicate that the next phase of adoption will depend less on early innovators and more on whether smaller firms and traditional industries across the state begin scaling AI use.
When it comes to future AI use, current leaders are mostly expected to remain steady, but many states seem to be moving upward quickly. Utah demonstrates the most dramatic potential, skyrocketing from 29th in active use to third in projected future adoption, with 26.1 percent of businesses preparing to implement AI down the road. A report from Anthropic found that Utah’s use of its AI platform, Claude, is 3.78 times higher than its share of the working-age population in the United States. Furthermore, in January 2026, the Utah Department of Commerce announced the first state-approved health platform that allows an AI system to legally participate in medical decision-making in the country. These developments bode well for Utah’s AI growth.
Texas also seems to be gearing up for major expansion, climbing from 10th to fourth place. Texas is rapidly emerging as the world’s largest data center market, driven by colossal, multi-billion-dollar AI infrastructure projects that leverage the state’s abundant undeveloped land. The largest of these projects is the Stargate Project. This $500 billion artificial intelligence venture aims to create a nationwide network of data centers, starting with a flagship facility in Abilene, Texas.
Why state AI adoption differs
Industry and economics are the most obvious reasons why some states are incorporating AI into daily work more quickly. As we’ve seen, states with significant data-driven economies, such as technology firms and professional service providers, tend to see higher AI adoption rates.
In contrast, states with agricultural or manufacturing-based economies are showing lower overall adoption rates. West Virginia and New Mexico, for example, sit at the bottom with current AI use of only 7.1 percent and 9 percent, respectively. In these states, a day at work may offer fewer immediate opportunities for AI use compared to a software firm or a logistics center.
Workforce characteristics also influence this trend. States with younger workforces, like Texas and Utah, may find it easier to integrate AI tools into daily operations. A McKinsey report found that Millennials are the most active and skilled generation of generative AI users, with around 62 percent of employees aged 35 to 44 reporting high levels of expertise. An impressive 90 percent report feeling comfortable using gen AI at work, demonstrating how crucial they are to advancing and innovating this technology.
In fact, 81 percent of Millennials expressed interest in helping design AI tools, and 76 percent actively provide feedback on these technologies. Gen Z ranks second, with 50 percent reporting high levels of expertise and 80 percent feeling comfortable using AI at work. Employees aged 25 to 34 are closely behind, with 49 percent reporting extensive familiarity. This contrasts sharply with the 22 percent of employees aged 65 and older who report expertise.
Surprisingly, New York and New Jersey rank lower than one might expect given their status as global centers of white-collar commerce. New York ranks 36th with 13.9 percent current use, while New Jersey trails at 41st with 12.7 percent. While these states are home to industries that are theoretically ideal for AI, like finance and media, they are also heavily regulated. Because AI technology is relatively new, hallucinations are another obstacle that can make its use too risky and unreliable for high-caliber business operations. For this reason, we’ll likely see much slower AI adoption in these places.
The growth of AI adoption in businesses reflects lasting changes in how Americans work. From Colorado to Maryland, the trends show that businesses are responding to the need for efficiency and data management. As AI becomes more closely tied to everyday business functions, having the right communications systems in place becomes even more important.
Whether your business is in a high-tech hub or a growing market, staying competitive requires reliable communication. As you modernize your operations, Ooma can provide the advanced business phone and communication solutions you need to support a modern, efficient workforce. Visit Ooma today to learn more about how we can help your business connect.
States ranked by current and future AI use
Current AI use
Percentage of businesses that answered “yes” to the following question:
In the last two weeks, did this business use artificial intelligence (AI) in any of its business functions? (Examples of AI: machine learning, natural language processing, virtual agents, voice recognition, etc.)
| Rank (Current) | State | Current AI Use |
|---|---|---|
| 1 | Colorado | 25.2% |
| 2 | Arizona | 24.5% |
| 3 | Nevada | 21.3% |
| 4 | Maryland | 21.2% |
| 5 | Oregon | 21.1% |
| 6 | North Carolina | 20.6% |
| 7 | Tennessee | 20.4% |
| 8 | Nebraska | 20.2% |
| 9 | Virginia | 19.8% |
| 10 | Texas | 19.6% |
| 11 | California | 19.4% |
| 12 | Kansas | 19.1% |
| 13 | Minnesota | 19.1% |
| 14 | Wyoming | 19.0% |
| 15 | Indiana | 18.9% |
| 16 | Missouri | 18.6% |
| 17 | Washington | 17.8% |
| 18 | Massachusetts | 17.7% |
| 19 | Delaware | 17.4%* |
| 20 | Georgia | 16.6% |
| 21 | Florida | 16.5% |
| 22 | Michigan | 16.4% |
| 23 | South Carolina | 16.2% |
| 24 | Ohio | 15.9% |
| 25 | Oklahoma | 15.8% |
| 26 | Connecticut | 15.7% |
| 27 | Pennsylvania | 15.5% |
| 28 | Hawaii | 15.4% |
| 29 | Utah | 15.3% |
| 30 | Montana | 14.6% |
| 31 | Alabama | 14.5% |
| 32 | Arkansas | 14.4% |
| 33 | Illinois | 14.4% |
| 34 | Iowa | 14.2% |
| 35 | Wisconsin | 14.2% |
| 36 | New York | 13.9% |
| 37 | Kentucky | 13.5% |
| 38 | Louisiana | 13.3% |
| 39 | Vermont | 13.1%* |
| 40 | Idaho | 12.8% |
| 41 | New Jersey | 12.7% |
| 42 | New Hampshire | 11.8% |
| 43 | Mississippi | 11.6% |
| 44 | South Dakota | 11.5% |
| 45 | Maine | 11.4% |
| 46 | Rhode Island | 11.1%* |
| 47 | New Mexico | 9.0% |
| 48 | West Virginia | 7.1%* |
| 49 | North Dakota | –* |
| 50 | Alaska | –* |
Projected future AI use
Percentage of businesses that answered “yes” to the following question:
During the next six months, do you think this business will be using artificial intelligence (AI) in any of its business functions? (Examples of AI: machine learning, natural language processing, virtual agents, voice recognition, etc.)
| Rank (Future) | State | Future AI Use |
|---|---|---|
| 1 | Colorado | 27.8% |
| 2 | Arizona | 27.2% |
| 3 | Utah | 26.1% |
| 4 | Texas | 25.8% |
| 5 | Maryland | 25.5% |
| 6 | South Carolina | 25.1% |
| 7 | Kansas | 23.9% |
| 8 | California | 23.6% |
| 9 | Nevada | 23.1% |
| 10 | Nebraska | 23.1% |
| 11 | Virginia | 23.0% |
| 12 | Minnesota | 22.9% |
| 13 | Delaware | 22.7% |
| 14 | Wyoming | 22.5% |
| 15 | Washington | 22.1% |
| 16 | North Carolina | 21.9% |
| 17 | Connecticut | 21.2% |
| 18 | Michigan | 21.1% |
| 19 | Oregon | 20.9% |
| 20 | Indiana | 20.8% |
| 21 | Florida | 20.7% |
| 22 | Georgia | 20.3% |
| 23 | Missouri | 20.2% |
| 24 | Ohio | 19.9% |
| 25 | Iowa | 19.9% |
| 26 | Arkansas | 19.7% |
| 27 | Massachusetts | 19.6% |
| 28 | Illinois | 19.0% |
| 29 | Tennessee | 18.7% |
| 30 | Wisconsin | 18.4% |
| 31 | Montana | 18.0% |
| 32 | Pennsylvania | 17.9% |
| 33 | Kentucky | 17.7% |
| 34 | South Dakota | 17.7% |
| 35 | Maine | 17.7% |
| 36 | Hawaii | 17.6% |
| 37 | Rhode Island | 17.3% |
| 38 | Idaho | 16.8% |
| 39 | Louisiana | 16.7% |
| 40 | Oklahoma | 16.5% |
| 41 | New Jersey | 16.5% |
| 42 | New York | 15.5% |
| 43 | Alabama | 15.3% |
| 44 | New Mexico | 14.6% |
| 45 | Mississippi | 14.4% |
| 46 | North Dakota | 12.0%* |
| 47 | New Hampshire | 12.2% |
| 48 | Vermont | 11.7%* |
| 49 | Alaska | 10.6% |
| 50 | West Virginia | 8.6%* |
*Data for the U.S. Census Business Trends and Outlook Survey is collected every two weeks and broken down into 24 different data segments throughout the year. The data included in this analysis is from the 24th segment in 2025. The most recent estimate for several states was suppressed due to quality concerns. In those cases, the most recent available data was used instead. The details are:
- Delaware’s Current AI Use percentage is from the previous segment.
- North Dakota’s Future AI Use percentage is from six segments prior.
- Rhode Island’s Current AI Use percentage is from four segments prior.
- Vermont’s Current AI Use and Future AI Use percentages are from the previous segment.
- West Virginia’s Current AI Use and Future AI Use percentages are from two segments prior.
- The Current AI Use data was suppressed for all 24 segments of 2025 for both North Dakota and Alaska.
Source:
U.S. Census Bureau, Business Trends and Outlook Survey (BTOS) 2023–2025
Husain Sumra is a former journalist who reported on the biggest companies in tech, from Apple to Amazon, covering cloud services, consumer technology and communication solutions. His journalism background has helped him bring a customer-first approach to content marketing, creating pieces of content aimed at helping people.