Where in the U.S. are small business owners the oldest (and youngest) on average?
 | May 22, 2025 | 6 min read |

From family-run food trucks to high-tech startups, entrepreneurship takes many forms across the United States. Starting a business can be a response to a lifelong ambition, a desire to fill a local need or a sudden shift in career path. The motivations behind small business ownership are as varied as the people who pursue them, and as it turns out, this entrepreneurial drive isn’t exclusive to one single generation. Age offers important insights into the broader trends shaping today’s business environment. From cities favored by younger business founders to regions where seasoned professionals remain at the helm, clear patterns speak to both local demographics and broader cultural dynamics. In this report from Ooma, we’re looking at which metro areas are home to the nation’s youngest and oldest business owners.
Which city has the youngest business owners?
Starting with the youngest, the Provo–Orem–Lehi metropolitan area in Utah leads the list with an average business owner age just shy of 49. This figure is significantly lower than the national average by almost a decade, a trend that continues in other metro areas in the state. Utah makes a strong showing overall, with Logan, Ogden, St. George and Salt Lake City all landing in the top seven. This is largely thanks to historically high birth rates and a culture focusing on family and community. With a younger population, it makes sense that more young people would be available to start businesses. Additionally, Utah has been experiencing an economic boom for many years, providing opportunities to young business owners. This creates a unique environment where younger individuals are not only starting businesses but often doing so with the support of larger family units or communities. When you combine these elements with access to educational institutions and a lower cost of living compared to places like California, Massachusetts and New York, it’s no wonder that Utah cities rise to the top of the list for young entrepreneurs across America.
With cities like Lincoln, Nebraska; Sioux Falls, South Dakota; and Madison, Wisconsin making the list, it’s clear that the Rockies and Upper Midwest are also hotbeds for ambitious, young entrepreneurs. In places like Fargo, North Dakota, where the average business owner is in their early 50s, the low cost of living appears to be a boon to business owners. Conversely, while the cost of living in Boise, Idaho, at number eight on the list, is more expensive on average, the presence of Boise State University may provide young people more economic opportunities and boost the population of younger people in the area.
Which city has the oldest business owners?
On the other end of the scale, some metro areas are dominated by more seasoned business owners. Santa Fe, New Mexico, leads the pack, with an average business owner age of nearly 59. In second place is Napa, California. Many higher-ranking places are retirement-friendly or have slower population growth, which may lead to older individuals remaining in business longer or even starting ventures later in life. Another factor may be the cost of living. For example, urban Honolulu, Hawaii, lands at number five on the list of places with the oldest business owners in the country. While known for its tourism, Hawaii has the highest cost of living in the nation, which may deter younger entrepreneurs and favor those with more resources and experience.
Why are most business owners older?
According to the numbers, many business owners are in their late 40s or early 50s when they enter entrepreneurship. That might seem older than expected, especially given the media spotlight on young startup founders, but there’s a good reason for it. Starting a business often takes time, resources and connections that are more readily available to those who’ve been in the workforce for a while, and experience can be a powerful asset in navigating the challenges of business ownership. Research suggests that older business owners tend to be more successful: While younger business owners might be bolder and more willing to take risks, older business owners bring stability, deep industry knowledge and strong networks.
Interestingly, the average age of business owners is relatively consistent across the country. The national average age range spans approximately 10 years, from 49 to nearly 59. A 10-year spread across the country isn’t a terribly wide gap, especially considering how much population demographics can vary. For instance, Santa Maria, California, has a relatively young median age of 34.9, but its mean business owner age is nearly 56. Even in Utah, where the population trends younger, business owners are still firmly middle-aged on average.
What does this analysis tell us about business ownership in America? Mostly, entrepreneurship is not confined to a specific demographic but is shaped by a range of regional, cultural and economic factors. Whether in a buzzing college town or a quiet coastal retreat, the drive to build something meaningful is a common thread. Of course, no matter where you live or how old you are, running a business requires support, good communication and the tools to succeed. Ooma provides modern, adaptable communication solutions designed to help small business owners maintain professionalism, stay connected and operate efficiently. Whether you are just beginning your entrepreneurial journey or are continuing to grow an established enterprise, Ooma is here to support your next big move.
The cities with the oldest and youngest business owners
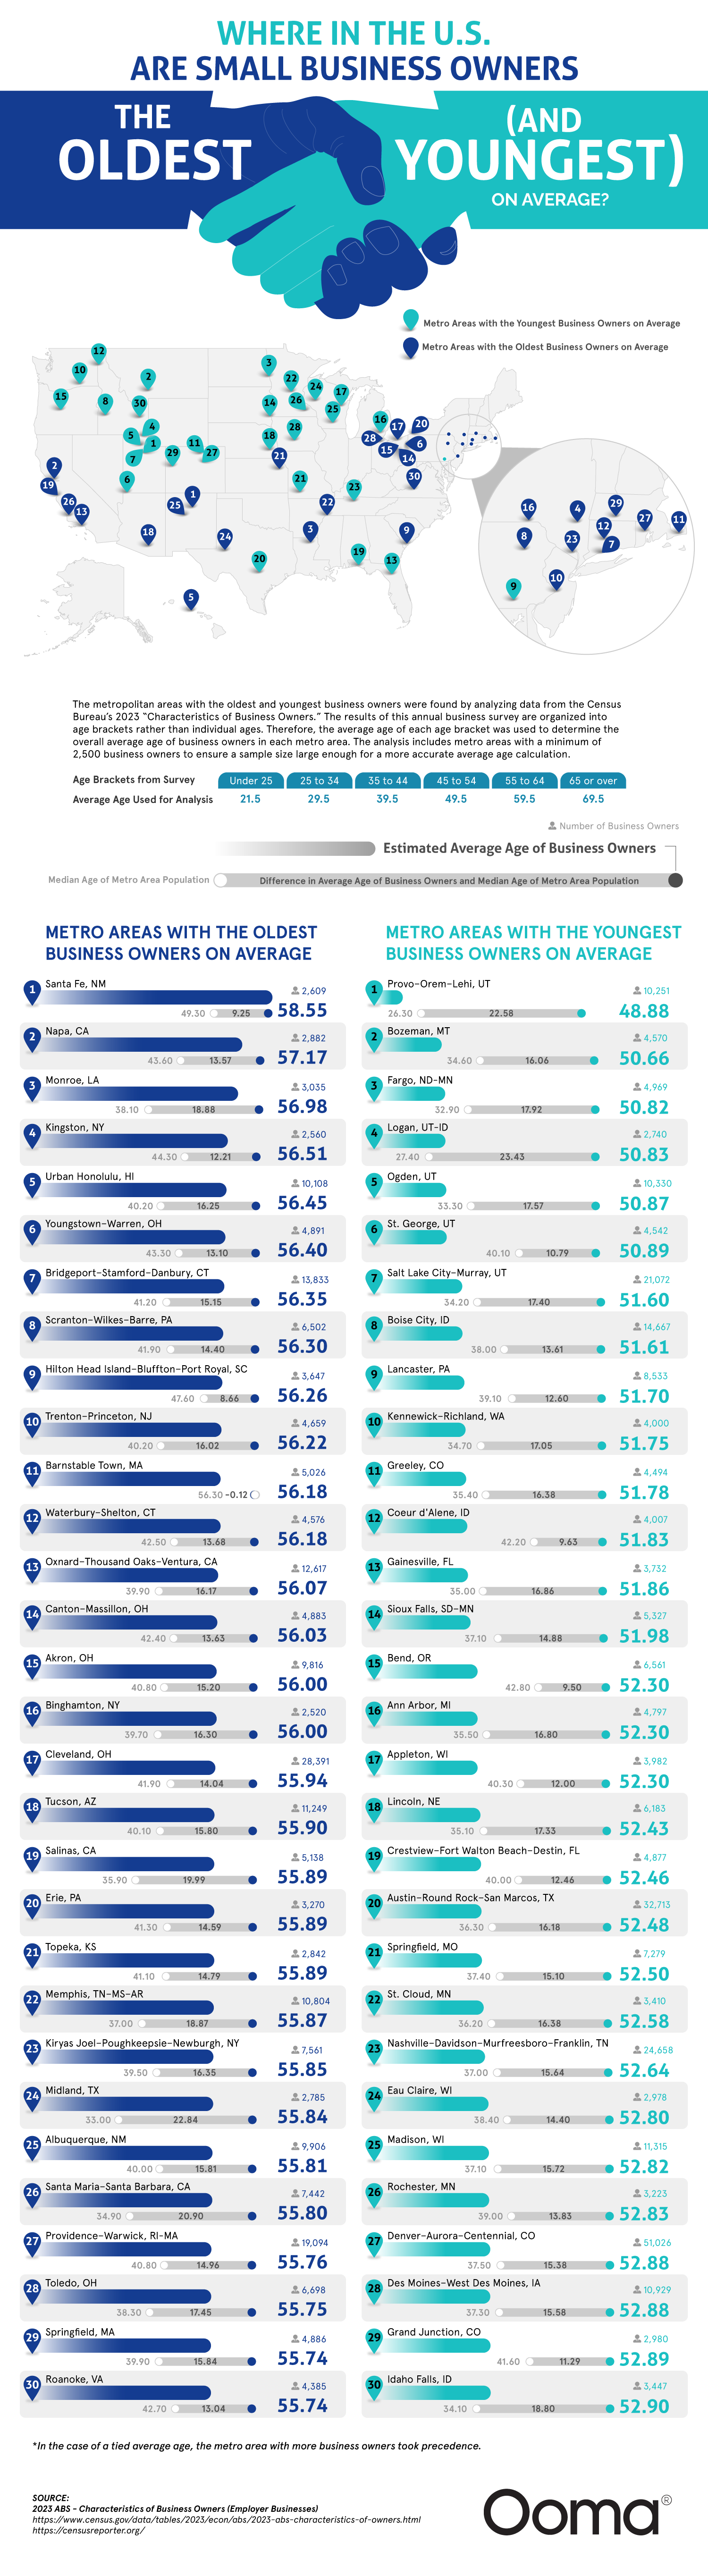
The metropolitan areas with the oldest and youngest business owners were found by analyzing data from the Census Bureau’s 2023 “Characteristics of Business Owners.” The results of this annual business survey are organized into age brackets rather than individual ages. Therefore, the average age of each age bracket was used to determine the overall average age of business owners in each metro area. The analysis includes metro areas with a minimum of 2,500 business owners to ensure a sample size large enough for a more accurate average age calculation.
The average ages used for each age bracket were:
- Under 25: 21.5
- 25 to 34: 29.5
- 35 to 44: 39.5
- 45 to 54: 49.5
- 55 to 64: 59.5
- 65 and older: 69.5
Metro areas with the oldest business owners on average
| Metro area | Number of business owners | Estimated average age of business owners (in years) | Median age of metro area population | Difference in average age of business owners and median age of metro area population | |
|---|---|---|---|---|---|
| 1 | Santa Fe, NM | 2,609 | 58.55 | 49.3 | 9.3 |
| 2 | Napa, CA | 2,882 | 57.17 | 43.6 | 13.6 |
| 3 | Monroe, LA | 3,035 | 56.98 | 38.1 | 18.9 |
| 4 | Kingston, NY | 2,560 | 56.51 | 44.3 | 12.2 |
| 5 | Urban Honolulu, HI | 10,108 | 56.45 | 40.2 | 16.3 |
| 6 | Youngstown–Warren, OH | 4,891 | 56.40 | 43.3 | 13.1 |
| 7 | Bridgeport–Stamford–Danbury, CT | 13,833 | 56.35 | 41.2 | 15.2 |
| 8 | Scranton–Wilkes-Barre, PA | 6,502 | 56.30 | 41.9 | 14.4 |
| 9 | Hilton Head Island–Bluffton–Port Royal, SC | 3,647 | 56.26 | 47.6 | 8.7 |
| 10 | Trenton–Princeton, NJ | 4,659 | 56.22 | 40.2 | 16.0 |
| 11 | Barnstable Town, MA | 5,026 | 56.18 | 56.3 | -0.1 |
| 12 | Waterbury–Shelton, CT | 4,576 | 56.18 | 42.5 | 13.7 |
| 13 | Oxnard–Thousand Oaks–Ventura, CA | 12,617 | 56.07 | 39.9 | 16.2 |
| 14 | Canton–Massillon, OH | 4,883 | 56.03 | 42.4 | 13.6 |
| 15 | Akron, OH | 9,816 | 56.00 | 40.8 | 15.2 |
| 16 | Binghamton, NY | 2,520 | 56.00 | 39.7 | 16.3 |
| 17 | Cleveland, OH | 28,391 | 55.94 | 41.9 | 14.0 |
| 18 | Tucson, AZ | 11,249 | 55.90 | 40.1 | 15.8 |
| 19 | Salinas, CA | 5,138 | 55.89 | 35.9 | 20.0 |
| 20 | Erie, PA | 3,270 | 55.89 | 41.3 | 14.6 |
| 21 | Topeka, KS | 2,842 | 55.89 | 41.1 | 14.8 |
| 22 | Memphis, TN–MS–AR | 10,804 | 55.87 | 37.0 | 18.9 |
| 23 | Kiryas Joel–Poughkeepsie–Newburgh, NY | 7,561 | 55.85 | 39.5 | 16.4 |
| 24 | Midland, TX | 2,785 | 55.84 | 33.0 | 22.8 |
| 25 | Albuquerque, NM | 9,906 | 55.81 | 40.0 | 15.8 |
| 26 | Santa Maria–Santa Barbara, CA | 7,442 | 55.80 | 34.9 | 20.9 |
| 27 | Providence–Warwick, RI-MA | 19,094 | 55.76 | 40.8 | 15.0 |
| 28 | Toledo, OH | 6,698 | 55.75 | 38.3 | 17.5 |
| 29 | Springfield, MA | 4,886 | 55.74 | 39.9 | 15.8 |
| 30 | Roanoke, VA | 4,385 | 55.74 | 42.7 | 13.0 |
Metro areas with the youngest business owners on average
| Metro area | Number of business owners | Estimated average age of business owners (in years) | Median age of metro area population | Difference in average age of business owners and median age of metro area population | |
|---|---|---|---|---|---|
| 1 | Provo–Orem–Lehi, UT | 10,251 | 48.88 | 26.3 | 22.6 |
| 2 | Bozeman, MT | 4,570 | 50.66 | 34.6 | 16.1 |
| 3 | Fargo, ND-MN | 4,969 | 50.82 | 32.9 | 17.9 |
| 4 | Logan, UT-ID | 2,740 | 50.83 | 27.4 | 23.4 |
| 5 | Ogden, UT | 10,330 | 50.87 | 33.3 | 17.6 |
| 6 | St. George, UT | 4,542 | 50.89 | 40.1 | 10.8 |
| 7 | Salt Lake City–Murray, UT | 21,072 | 51.60 | 34.2 | 17.4 |
| 8 | Boise City, ID | 14,667 | 51.61 | 38.0 | 13.6 |
| 9 | Lancaster, PA | 8,533 | 51.70 | 39.1 | 12.6 |
| 10 | Kennewick–Richland, WA | 4,000 | 51.75 | 34.7 | 17.1 |
| 11 | Greeley, CO | 4,494 | 51.78 | 35.4 | 16.4 |
| 12 | Coeur d’Alene, ID | 4,007 | 51.83 | 42.2 | 9.6 |
| 13 | Gainesville, FL | 3,732 | 51.86 | 35.0 | 16.9 |
| 14 | Sioux Falls, SD–MN | 5,327 | 51.98 | 37.1 | 14.9 |
| 15 | Bend, OR | 6,561 | 52.30 | 42.8 | 9.5 |
| 16 | Ann Arbor, MI | 4,797 | 52.30 | 35.5 | 16.8 |
| 17 | Appleton, WI | 3,982 | 52.30 | 40.3 | 12.0 |
| 18 | Lincoln, NE | 6,183 | 52.43 | 35.1 | 17.3 |
| 19 | Crestview–Fort Walton Beach–Destin, FL | 4,877 | 52.46 | 40.0 | 12.5 |
| 20 | Austin–Round Rock–San Marcos, TX | 32,713 | 52.48 | 36.3 | 16.2 |
| 21 | Springfield, MO | 7,279 | 52.50 | 37.4 | 15.1 |
| 22 | St. Cloud, MN | 3,410 | 52.58 | 36.2 | 16.4 |
| 23 | Nashville–Davidson–Murfreesboro–Franklin, TN | 24,658 | 52.64 | 37.0 | 15.6 |
| 24 | Eau Claire, WI | 2,978 | 52.80 | 38.4 | 14.4 |
| 25 | Madison, WI | 11,315 | 52.82 | 37.1 | 15.7 |
| 26 | Rochester, MN | 3,223 | 52.83 | 39.0 | 13.8 |
| 27 | Denver–Aurora–Centennial, CO | 51,026 | 52.88 | 37.5 | 15.4 |
| 28 | Des Moines–West Des Moines, IA | 10,929 | 52.88 | 37.3 | 15.6 |
| 29 | Grand Junction, CO | 2,980 | 52.89 | 41.6 | 11.3 |
| 30 | Idaho Falls, ID | 3,447 | 52.90 | 34.1 | 18.8 |
Sources
- 2023 ABS — Characteristics of Business Owners (Employer Businesses)
- https://www.census.gov/data/tables/2023/econ/abs/2023-abs-characteristics-of-owners.html
- https://censusreporter.org/
Diane Balogh has more than 10 years of experience researching, editing and writing for and about the telecommunications industry. Her blog posts have appeared on ooma.com, TechBuzz.att.com, OnSIP.com and Talkatone.com. A graduate of the University of Missouri School of Journalism with an area of emphasis in science writing, she specializes in translating complex topics into language that is easy to understand.