The Most Addictive Apps Throughout the Years
 | December 6, 2016 | 3 min read |
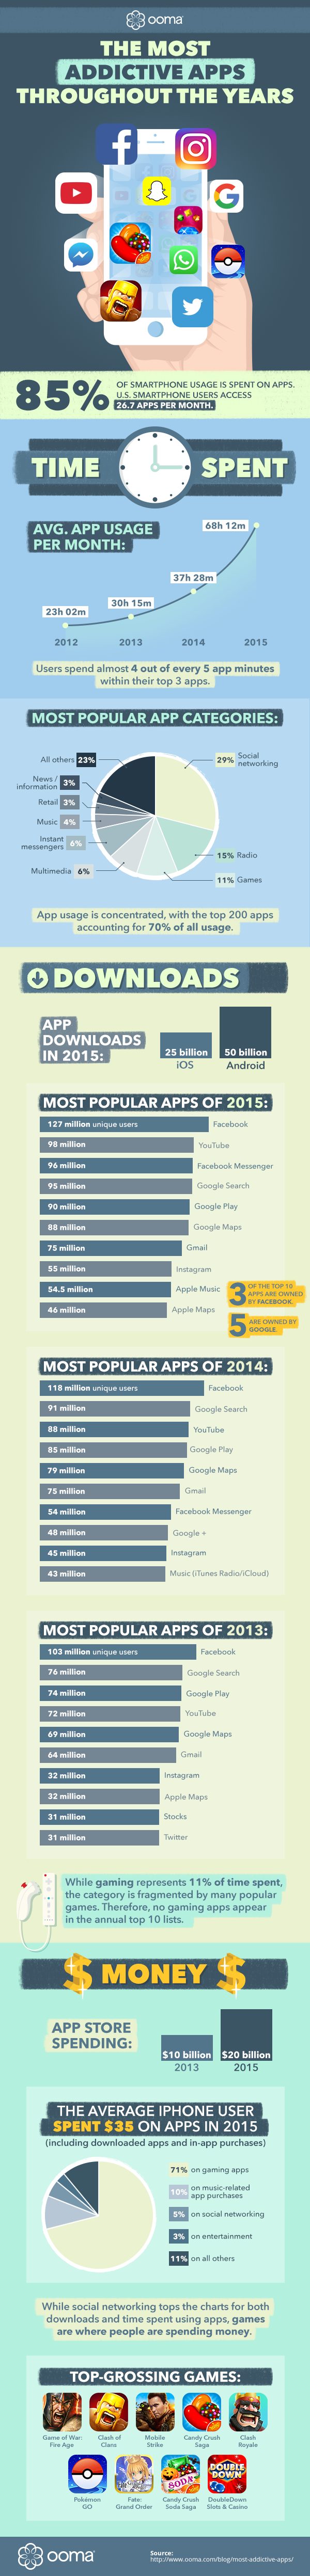
People are spending a lot of time and money on smartphone apps, and the numbers may surprise you. Did you know that 85% of smartphone usage is spent on apps? Did you realize that U.S. smartphone users access 26.7 apps per month?Here’s a breakdown of what was downloaded, how it was used and how much money was spent. Time SpentApp usage has been increasing steadily each year. In 2012, users spent on average 23 hours and 2 minutes using apps each month. This increased to 30 hours and 15 minutes in 2013, 37 hours and 28 minutes in 2014, and then jumped to 68 hours and 12 minutes in 2015.And this time was concentrated around just a few apps. Users spend almost 4 out of every 5 app minutes within their top 3 apps.The most popular app categories based on usage are:social networking (29%), radio (15%), games (11%), multimedia (6%), chat (6%), music (4%), retail (3%) and news/information (3%); all others amount to 23% combined.Just a few apps gain significant market penetration as well. 70% percent of all usage is concentrated in the top 200 apps available to consumers.DownloadsIn 2015, there were 50 billion apps downloaded on the Android platform and 25 billion downloaded on iOS.The most popular apps of 2015 were Facebook (127 million unique users), YouTube (98 million), Facebook Messenger (96 million), Google Search (95 million), Google Play (90 million), Google Maps (88 million), Gmail (75 million), Instagram (55 million), Apple Music (54.5 million) and Apple Maps (46 million).Notably, 3 of the top 10 apps are owned by Facebook and 5 are owned by Google.In 2014, the most popular apps were Facebook (118 million unique users), Google Search (91 million), YouTube (88 million), Google Play (85 million), Google Maps (79 million), Gmail (72 million), Facebook Messenger (54 million), Google+ (78 million), Instagram (44 million) and Music, including iTunes Radio and iCloud (43 million).In 2013, the most popular apps were Facebook (103 million unique users), Google Search (76 million), Google Play (74 million), YouTube (72 million), Google Maps (69 million), Gmail (64 million), Instagram (32 million), Apple Maps (32 million), Stocks (31 million) and Twitter (31 million).You may be surprised that Candy Crush and other games are not included in these lists of the most popular apps. While gaming represents 11% of time spent, the category is fragmented by many popular games. Therefore, no gaming apps appear in the annual top 10 lists.MoneyIn just 2 years, app spending doubled. In 2013, spending was $10 billion, and in 2015, it spiked to $20 billion.The average iPhone user spent $35 on apps in 2015 (including downloaded apps and in-app purchases). Gaming apps accounted for 71% of all spending. Music-related app purchases clocked in at only 10% of spending. Social networking was just 5% of spending, and entertainment was 3% of spending.While social networking tops the charts for both downloads and time spent using apps, games are where people are spending money. The top-grossing games are: Game of War: Fire Age, Clash of Clans, Mobile Strike, Candy Crush Saga, Clash Royale, Pokémon GO, Fate/Grand Order, Candy Crush Soda Saga and DoubleDown Slots & Casino.Paste this Image on Your Site!Simply copy and paste the code below and you can share this infographic on your site:Sources:http://www.nielsen.comhttps://www.comscore.com/Insights/Presentations-and-Whitepapers/2015/The-2015-US-Mobile-App-Reporthttp://www.businessofapps.com/app-usage-statistics-2015/http://qz.com/481245/these-are-the-25-most-popular-2015-mobile-apps-in-america/ http://time.com/4169153/apple-app-store-stats-2015/https://sensortower.com/blog/revenue-per-iphone-2015https://thinkgaming.com/
 Time SpentApp usage has been increasing steadily each year. In 2012, users spent on average 23 hours and 2 minutes using apps each month. This increased to 30 hours and 15 minutes in 2013, 37 hours and 28 minutes in 2014, and then jumped to 68 hours and 12 minutes in 2015.And this time was concentrated around just a few apps. Users spend almost 4 out of every 5 app minutes within their top 3 apps.The most popular app categories based on usage are:social networking (29%), radio (15%), games (11%), multimedia (6%), chat (6%), music (4%), retail (3%) and news/information (3%); all others amount to 23% combined.Just a few apps gain significant market penetration as well. 70% percent of all usage is concentrated in the top 200 apps available to consumers.DownloadsIn 2015, there were 50 billion apps downloaded on the Android platform and 25 billion downloaded on iOS.The most popular apps of 2015 were Facebook (127 million unique users), YouTube (98 million), Facebook Messenger (96 million), Google Search (95 million), Google Play (90 million), Google Maps (88 million), Gmail (75 million), Instagram (55 million), Apple Music (54.5 million) and Apple Maps (46 million).Notably, 3 of the top 10 apps are owned by Facebook and 5 are owned by Google.In 2014, the most popular apps were Facebook (118 million unique users), Google Search (91 million), YouTube (88 million), Google Play (85 million), Google Maps (79 million), Gmail (72 million), Facebook Messenger (54 million), Google+ (78 million), Instagram (44 million) and Music, including iTunes Radio and iCloud (43 million).In 2013, the most popular apps were Facebook (103 million unique users), Google Search (76 million), Google Play (74 million), YouTube (72 million), Google Maps (69 million), Gmail (64 million), Instagram (32 million), Apple Maps (32 million), Stocks (31 million) and Twitter (31 million).You may be surprised that Candy Crush and other games are not included in these lists of the most popular apps. While gaming represents 11% of time spent, the category is fragmented by many popular games. Therefore, no gaming apps appear in the annual top 10 lists.MoneyIn just 2 years, app spending doubled. In 2013, spending was $10 billion, and in 2015, it spiked to $20 billion.The average iPhone user spent $35 on apps in 2015 (including downloaded apps and in-app purchases). Gaming apps accounted for 71% of all spending. Music-related app purchases clocked in at only 10% of spending. Social networking was just 5% of spending, and entertainment was 3% of spending.While social networking tops the charts for both downloads and time spent using apps, games are where people are spending money. The top-grossing games are: Game of War: Fire Age, Clash of Clans, Mobile Strike, Candy Crush Saga, Clash Royale, Pokémon GO, Fate/Grand Order, Candy Crush Soda Saga and DoubleDown Slots & Casino.Paste this Image on Your Site!Simply copy and paste the code below and you can share this infographic on your site:Sources:http://www.nielsen.comhttps://www.comscore.com/Insights/Presentations-and-Whitepapers/2015/The-2015-US-Mobile-App-Reporthttp://www.businessofapps.com/app-usage-statistics-2015/http://qz.com/481245/these-are-the-25-most-popular-2015-mobile-apps-in-america/ http://time.com/4169153/apple-app-store-stats-2015/https://sensortower.com/blog/revenue-per-iphone-2015https://thinkgaming.com/
 About the Author
Thad is the Vice President of Product Management at Ooma, responsible for driving great user experiences across Ooma’s portfolio of hardware devices, mobile apps, and services. Thad has more than 20 years experience building and managing consumer tech products at leading tech companies including Yahoo!, BlackBerry, and 3jam (acquired by Skype). He has worked on messaging and communications products used by hundreds of millions of people worldwide. Thad holds a BA from Rice University in cognitive science and linguistics.